Draw Recap Reports and Hunting Statistics
 Use the Draw Recap walkthrough to get familiar with the format by hovering your cursor over any portion of the report to view information about that field.
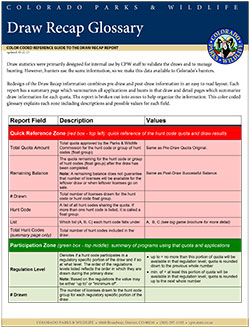
A draw recap reports glossary is available to help explain some of the terms you’ll find within the report.
How to Read Draw Statistics 2014 and Earlier
Why is the format so hard to read? The Hunting Recap information was originally compiled for internal use by CPW staff. It was not designed for external use by the public. However, much of this information has been valuable to hunters, so we make this data available as a public service.
Example with explanation
In explaining how to interpret these data, we'll use hunt code – EE07601A from the 1999 Elk Recap Hunt Summary as our example.
On the far left under Hunt Code, it says - EE076O1A. This means elk, either sex, unit 76, 1st season, archery. Under Quotas, it says Reg (regular, resident license), LOwn (landowners), NRes (non-residents), Yth (youth). Notice that a total of 125 licenses were issued under this hunt code. Under No. Apps (# of applicants) is the number of people who applied for this license as their 1st choice and 2nd choice - 684 had it as 1st choice, 148 had it as 2nd choice. The next 2 columns are Public/Land Owner, which lists the number of people who applied, broken down by category: 315 residents applied, 362 non-residents, no youth, 4 resident landowners, and 3 non-resident landowners.
| Quotas | No. Apps | Public | Land Own |
| Hunt Code | Reg | LOwn | NRes | Yth | Ch1 | Ch2 | Res | NonRes | Yth | Res | NonRes |
| EE07601A | 125 | 0 | 0 | 0 | 684 | 148 | 315 | 362 | 0 | 4 | 3 |
How to Read Preference Points
| 0 | 1 | 2 | 3 | 4 | 5 |
| 6 | 7 | 8 | 9 | 10 | 11+ |
| 193 | 138 | 189 | 134 | 19 | 6 |
| 3 | 2 | 0 | 0 | 0 | 0 |
The top 2 columns, 0-11+, show the number of Preference Points. The columns wrap, which is confusing. The bottom 2 columns are the numbers of hunters with those preference points that applied. So, in this example, 193 hunters applied with 0 preference points, 138 applied with 1 preference point...(next column), 3 hunters applied with 6 points (bottom row, far left column), 2 with 7 points, and no one applied with 8 or more points. To see how many preference points it took to actually get the license, look at the Quota (from table above), which was 125 total licenses issued, then count backwards under Preference Points (bottom row, far right side 1st, last number listed) until you reach 125. You count starting from the hunter who applied with the most points to see how many points you needed to get the license that year. Thus, you would add 2 + 3 + 6 + 19 + 134 = 164. So hunters with 7,6,5,4 and some who had 3 points all drew that license. The hunters with 2,1, and 0 points did not draw. These are only tallied for the 1st choice, in this case.
Why is the number of tags issued, under Quotas, shown just in the 1st season on some?
Looking at the 1999 Elk Recap, under EM04801R:
Below Quotas, there are 150 listed, which is the total number of licenses (tags) that were available for 1st, 2nd and 3rd season. In this case, they are only listed under the 1st season - they are not broken down by a certain number for each season. The number (150) is available to float into the other seasons (2nd and 3rd) as needed. Hunters can still determine the preference points it took to draw for each unit, somewhat. Look at Unit 48: total number of licenses issued = 150. So, look at the preference points and count backwards until you reach 150. 1 person with 5 points drew (1st season), 2 people drew with 4 points (3rd season), 10 people drew with 3 points (6 - 1st, 2 - 2nd, 2 - 3rd season), 53 people drew with 2 points ( 34 - 1st season, 12 - 2nd, 7 - 3rd). In the 1 preference point category (where the total reaches over 150 total) 84 people drew out of 115 who tried (83 – 1st, 50 – 2nd, 22 – 3rd), but it was a random draw throughout all the seasons - some drew, some didn't. People with 0 points had no chance at all, and none drew. In this case, no one applied with 6 or more preference points. If they had, there would be 2 rows of numbers under that hunt code.
| | Quotas | Preference Points |
| | | 0 | 1 | 2 | 3 | 4 | 5 |
| | | 6 | 7 | 8 | 9 | 10 | 11+ |
| EM04801R | 150 | 93 | 83 | 34 | 6 | 0 | 1 |
| EMO4802R | 0 | 64 | 50 | 12 | 2 | 0 | 0 |
| EM04803R | 0 | 38 | 22 | 7 | 2 | 2 | 0 |
We hope this helps! If you have further questions, please submit your question to AskCPW.